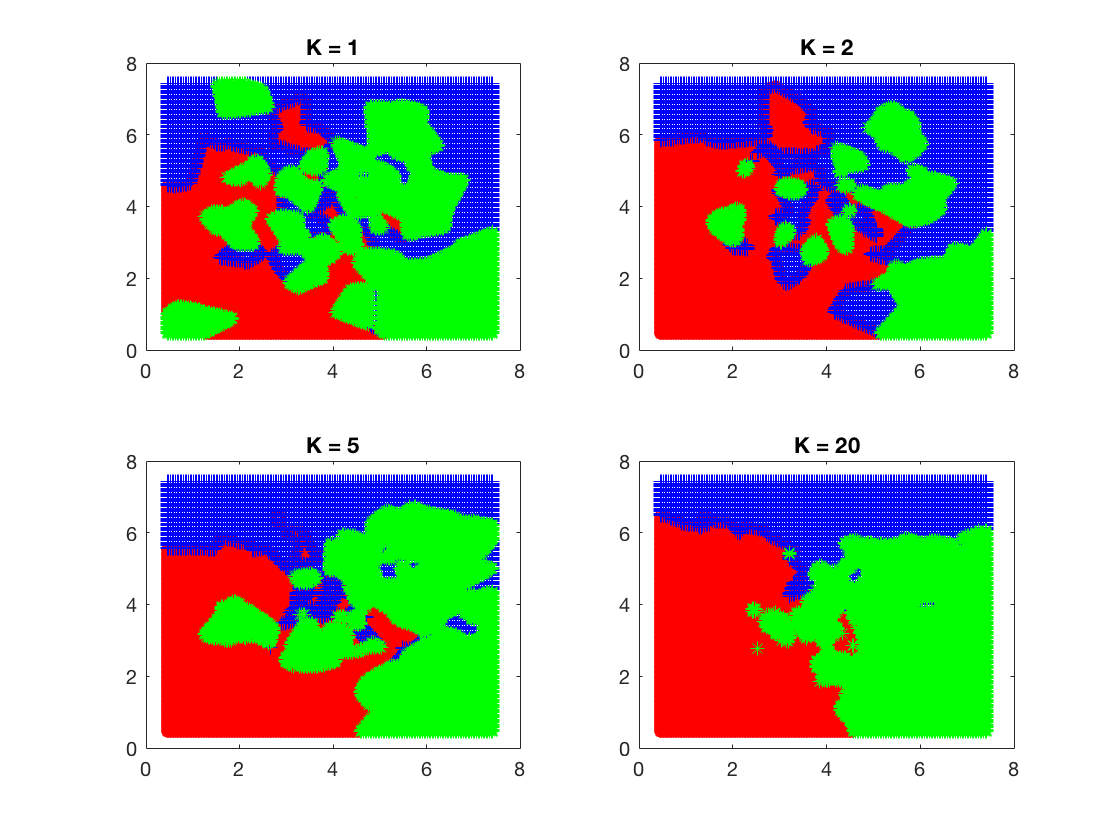
This is a KNN algorithm implementation written in Matlab. In this example, I’m just using some random numbers for X, Y, and the according labels. There are 3 classes differentiated by color.
For the distance I chose Euclidean distance. The algorithm loops through all records in the dataset, finds K closest neighbor points, and predict using the most occurring label.
In this example, I’m only running the algorithm against the training dataset. Therefore, for each iteration in the loop I need to avoid counting the record itself as a neighbor.
%Setting up X, Y, Classes, and K values, etc.
trainX = a(:,1:2);
trainY = a(:,3);
classes = unique(trainY);
n = size(trainY,1);
output = zeros(n,1);
klist = [1,2,5,20];
label = {'ro','b+','g*'};

%Use L2 distance method for the training data
for i=1:n
    distL2(i,:) = sum((trainX - ones(n,1)*trainX(i,1:2)).^2,2);%calc L2 distance
    distL2(i, i) = max(distL2(i,:))+1;%leave out the row with same index
    [j, ind] = sort(distTrL2(i,:));  %sort the distances
    %get the k nearest neighbors and choose the most occurring class
    for j=1:length(klist)
        k=klist(j);
        neighbors = trainY(ind(1:k));
        predTrain2(i,j) = mode(neighbors);
    end
end

resultTr2 = [trainX, predTrain2];

figure(1); hold off
    subplot(2,2,1)
    for i = 1:length(classes)
        pos = find(resultTr2(:,3)==classes(i));
        plot(resultTr2(pos,1),resultTr2(pos,2),label{i})
        hold on
    end
    title(sprintf('K = %g',1));

    subplot(2,2,2)
    for i = 1:length(classes)
        pos = find(resultTr2(:,4)==classes(i));
        plot(resultTr2(pos,1),resultTr2(pos,2),label{i})
        hold on
    end
    title(sprintf('K = %g',2));

    subplot(2,2,3)
    for i = 1:length(classes)
        pos = find(resultTr2(:,5)==classes(i));
        plot(resultTr2(pos,1),resultTr2(pos,2),label{i})
        hold on
    end
    title(sprintf('K = %g',5));

    subplot(2,2,4)
    for i = 1:length(classes)
        pos = find(resultTr2(:,6)==classes(i));
        plot(resultTr2(pos,1),resultTr2(pos,2),label{i})
        hold on
    end
    title(sprintf('K = %g',20));
Here are the plots generated. As the K values goes higher, the boundaries between classes becomes smoother.
